> ## Documentation Index
> Fetch the complete documentation index at: https://docs.galtea.ai/llms.txt
> Use this file to discover all available pages before exploring further.
# Direct Inferences and Evaluations from the Platform
> Learn how to configure Endpoint Connections to run inferences and evaluations directly from the Galtea Dashboard, without writing any SDK code.
Galtea allows you to run inferences against your AI system and evaluate its responses **directly from the Dashboard**, without writing any SDK code. This is made possible by [Endpoint Connections](/concepts/product/endpoint-connection), which tell Galtea how to call your API, extract the response, and manage session state across turns.
This guide covers the **platform-based** workflow. If you prefer to generate inferences programmatically (e.g., in a CI/CD pipeline or custom script), see the [SDK tutorials](/sdk/tutorials/run-test-based-evaluations) instead.
## Prerequisites
Before you begin, make sure you have the following set up in the [Galtea Dashboard](https://platform.galtea.ai/):
* A [Product](/concepts/product) representing your AI system
* A [Test](/concepts/product/test) with at least one [Test Case](/concepts/product/test/case) to run against your endpoint
## Workflow Overview
Define how Galtea should call your AI endpoint — URL, authentication, request format, and response extraction.
Create a new version of your product and attach the endpoint connection to it.
Select a test and run it against the version. Galtea calls your endpoint for each test case and records the inference results.
Once inferences are generated, trigger evaluations with the metrics of your choice to assess your AI's performance.
## Step 1: Create an Endpoint Connection
Navigate to your product in the Dashboard and go to the **Endpoint Connections** section. Click **New Endpoint Connection** and configure the following:
1. **Name** — A descriptive name (e.g., "Production Chat API").
2. **Type** — Select `CONVERSATION` for the primary request/response endpoint.
3. **URL** — The full URL of your AI endpoint (e.g., `https://api.company.com/v1/chat`).
4. **HTTP Method** — Typically `POST`.
5. **Authentication** — Choose the auth type (`Bearer`, `API_KEY`, `Basic`, or `None`) and provide the token.
6. **Input Template** — A Jinja2 template that defines the request body Galtea will send.
7. **Output Mapping** — JSONPath expressions that tell Galtea how to extract values from the response.
### Input Template
The input template uses [Jinja2](https://jinja.palletsprojects.com/) syntax with placeholders that Galtea fills automatically. At minimum, use `{{ input.user_message }}` to inject the test case input:
```jinja2 theme={"system"}
{
"model": "gpt-4",
"messages": [
{"role": "system", "content": "You are a helpful assistant."},
{"role": "user", "content": "{{ input.user_message }}"}
]
}
```
For multi-turn conversations, use `past_turns` to include conversation history:
```jinja2 theme={"system"}
{
"model": "gpt-4",
"messages": [
{"role": "system", "content": "You are a helpful assistant."},
{% for turn in past_turns %}
{"role": "user", "content": "{{ turn.input }}"},
{"role": "assistant", "content": "{{ turn.output }}"},
{% endfor %}
{"role": "user", "content": "{{ input.user_message }}"}
]
}
```
See [Endpoint Connection — Input Template](/concepts/product/endpoint-connection#input-template) for the full list of available placeholders and advanced template examples.
### Output Mapping
The output mapping tells Galtea how to extract values from the API response using [JSONPath](https://goessner.net/articles/JsonPath/) expressions. The `output` key is required:
```json theme={"system"}
{
"output": "$.choices[0].message.content"
}
```
You can also extract additional values to store as session metadata:
```json theme={"system"}
{
"output": "$.choices[0].message.content",
"retrieval_context": "$.choices[0].retrieval_context",
"session_id": "$.metadata.session_id"
}
```
Any extra key beyond the [special keys](/concepts/product/endpoint-connection-configuration#special-keys) (`output`, `retrieval_context`, `session_id`, `traces`) is saved to the session metadata and becomes available as a `{{ key }}` placeholder in subsequent turns.
#### Sending an extracted value back (the round-trip)
Extracting a value is only **half** of stateful multi-turn handling. If your agent returns an identifier on the first turn — a `thread_id`, `conversation_id`, or any token that groups subsequent messages — you must also **reference it in the Input Template** so Galtea sends it back on the next turn. Extraction alone stores the value but never resends it.
The round-trip has two coordinated sides:
```json Output Mapping (extract) theme={"system"}
{
"output": "$.content",
"thread_id": "$.thread_id"
}
```
```jinja2 Input Template (re-send) theme={"system"}
{
"message": { "type": "human", "content": "{{ input.user_message }}" },
"thread_id": "{{ thread_id }}"
}
```
Turn by turn:
1. **Turn 1** — `thread_id` has no value yet, so `{{ thread_id }}` renders as an empty string. Your agent creates a new thread and returns its id in the response.
2. **Extraction** — Output Mapping captures `$.thread_id` into session metadata.
3. **Turn 2+** — `{{ thread_id }}` now renders the captured id, so every following message is routed to the same thread.
Configuring the Output Mapping but leaving a **hardcoded** id (or omitting `{{ thread_id }}` entirely) in the Input Template is the most common mistake: the value is captured but never resent, so the agent either starts a fresh thread every turn or — worse, with a fixed id — collides every conversation onto one shared thread and leaks context across unrelated test cases.
On the first turn, undefined placeholders render as empty strings. If your agent **rejects** an empty `thread_id` (rather than treating it as "create a new thread"), omit the field entirely on the first turn with a conditional, minding the trailing comma so the body stays valid JSON:
```jinja2 theme={"system"}
{
"message": { "type": "human", "content": "{{ input.user_message }}" }{% if thread_id %},
"thread_id": "{{ thread_id }}"{% endif %}
}
```
See [Templates & Mapping — State Management](/concepts/product/endpoint-connection-configuration#state-management) for the full reference on how extracted values are stored and reused across turns.
## Step 2: Create a Version with the Endpoint Connection
Navigate to your product and create a new **Version**. When configuring the version:
1. Fill in the version name, model, and any other relevant properties.
2. In the **Conversation Endpoint Connection** field, select the endpoint connection you created in Step 1.
The Conversation Endpoint Connection is the only required endpoint connection. For most integrations, this single endpoint handles the entire interaction lifecycle.
If your AI system requires separate endpoints for session initialization or cleanup, you can optionally configure **Initialization** and **Finalization** endpoint connections. See [Version — Multi-Step Session Lifecycle](/concepts/product/version#multi-step-session-lifecycle-advanced) for details.
## Step 3: Run a Test
Once your version is set up with an endpoint connection, you can run tests directly from the Dashboard:
1. Navigate to your product's **Tests** section.
2. Select the test you want to run.
3. Choose the version with the configured endpoint connection.
4. Start the test run.
Galtea will iterate through each test case, call your endpoint using the configured endpoint connection, and record the resulting [Inference Results](/concepts/product/version/session/inference-result). Each test case produces a session with one or more inference results depending on whether it's a single-turn or multi-turn test.
## Step 4: Evaluate the Results
After the inferences have been generated, you can trigger evaluations:
1. Navigate to the session results in the Dashboard.
2. Select the [Metrics](/concepts/metric) you want to use for the evaluation.
3. Run the evaluation.
Galtea will assess each inference result using the selected metrics and provide scores and explanations.
For single-turn tests, metrics like [Factual Accuracy](/concepts/metric/factual-accuracy) and [Answer Relevancy](/concepts/metric/answer-relevancy) work well. For multi-turn conversations, consider [Knowledge Retention](/concepts/metric/knowledge-retention), [Role Adherence](/concepts/metric/role-adherence), and [Conversation Completeness](/concepts/metric/conversation-completeness).
## Collecting Traces During Direct Inference
There are three ways to collect [traces](/concepts/product/version/session/trace) during Direct Inference:
1. **Output Mapping (no code)** — Extract traces from the API response using a `traces` key in your output mapping.
2. **SDK `set_context` (in your handler)** — Pass `{{ inference_result_id }}` to your endpoint and use the SDK to create traces from within the handler.
3. **W3C Trace Context Propagation (zero code)** — Enable the `traceparent` header to automatically correlate your OTEL spans with Galtea inference results.
### Option 1: Extract Traces via Output Mapping
If your endpoint returns trace data in its response, you can extract it using the `traces` key in the output mapping. Galtea will store each trace object linked to the inference result automatically.
**Example API response:**
```json theme={"system"}
{
"response": "The answer is 42.",
"traces": [
{
"name": "retrieve_context",
"type": "RETRIEVER",
"latencyMs": 120,
"inputData": { "query": "meaning of life" },
"outputData": { "documents": ["..."] }
},
{
"name": "generate_response",
"type": "GENERATION",
"latencyMs": 350,
"inputData": { "context": "..." },
"outputData": { "text": "The answer is 42." }
}
]
}
```
**Output Mapping:**
```json theme={"system"}
{
"output": "$.response",
"traces": "$.traces"
}
```
Galtea extracts the `traces` array and creates `Trace` entities linked to the inference result. Each object in the array must contain at least a `name` field and can include any [Trace properties](/concepts/product/version/session/trace#trace-properties):
| Property | Type | Required | Description |
| --------------- | ------ | -------- | ------------------------------------------------------------------------------------------------------------------- |
| `name` | string | Yes | Name of the traced operation |
| `type` | string | No | One of: `SPAN`, `GENERATION`, `EVENT`, `AGENT`, `TOOL`, `CHAIN`, `RETRIEVER`, `EVALUATOR`, `EMBEDDING`, `GUARDRAIL` |
| `description` | string | No | Human-readable description of the operation |
| `inputData` | object | No | Input parameters passed to the operation |
| `outputData` | object | No | Result returned by the operation |
| `error` | string | No | Error message if the operation failed |
| `latencyMs` | number | No | Execution time in milliseconds |
| `metadata` | object | No | Additional custom metadata |
| `startTime` | string | No | ISO 8601 timestamp when the operation started |
| `endTime` | string | No | ISO 8601 timestamp when the operation completed |
| `parentTraceId` | string | No | ID of the parent trace for hierarchical relationships |
This approach requires no SDK code in your endpoint handler — it works purely through configuration.
### Option 2: Use `set_context` in Your Endpoint Handler
When running evaluations via Direct Inference, you can collect traces from your endpoint handler by linking the `inference_result_id` to your tracing context. Galtea automatically sends the `X-Galtea-Inference-Id` HTTP header with every Direct Inference request, so your endpoint can read it directly — no template changes needed.
Alternatively, you can pass `{{ inference_result_id }}` in the input template if you prefer to receive it in the request body.
#### 1. Get the `inference_result_id`
**From the HTTP header (recommended)** — available automatically on every Direct Inference call:
```python theme={"system"}
inference_result_id = request.headers.get("X-Galtea-Inference-Id")
```
**From the input template** — include the placeholder in your endpoint connection's input template:
```jinja2 theme={"system"}
{
"model": "gpt-4",
"messages": [
{"role": "user", "content": "{{ input.user_message }}"}
],
"metadata": {
"inference_result_id": "{{ inference_result_id }}"
}
}
```
#### 2. Use `set_context` in Your Endpoint Handler
In your API endpoint, extract the `inference_result_id` from the request and use the SDK's `set_context` / `clear_context` to associate traces with it:
```python theme={"system"}
@trace(type=TraceType.AGENT)
def run_agent(query: str) -> str:
# Your agent logic here — all nested @trace calls
# will be linked to the inference result automatically
return "Agent response to: " + query
def my_endpoint_handler(request):
"""Your API endpoint that Galtea calls during Direct Inference."""
body = request.json()
user_input = body["messages"][-1]["content"]
inference_result_id = body["metadata"]["inference_result_id"]
# Set trace context so all @trace calls are linked to this inference result
token = set_context(inference_result_id=inference_result_id)
try:
response = run_agent(user_input)
finally:
# Flush traces to Galtea and clear context
clear_context(token)
return {"choices": [{"message": {"content": response}}]}
```
All `@trace`-decorated functions called while the context is active will be automatically linked to the inference result in Galtea.
For a complete guide on tracing setup, decorators, and context managers, see the [Tracing Agent Operations](/sdk/tutorials/tracing-agent-operations) tutorial.
### Option 3: W3C Trace Context Propagation
If your service is instrumented with [OpenTelemetry](https://opentelemetry.io/), you can automatically correlate your internal spans with Galtea inference results using the [W3C Trace Context](https://www.w3.org/TR/trace-context/) standard — no code changes required on your side.
**Prerequisites:** Your service must be instrumented with OpenTelemetry and must receive the `traceparent` header Galtea sends with each Direct Inference request. This option correlates your spans with the inference results Direct Inference creates. To create production sessions from OTel traces without Direct Inference, see [Monitor Real User Traffic via OpenTelemetry](/sdk/tutorials/monitor-real-user-traffic-with-opentelemetry).
#### How it works
When enabled, Galtea creates a unique [W3C trace ID](https://www.w3.org/TR/trace-context/#trace-id) for each direct inference call and injects a `traceparent` header into the outbound request to your endpoint. Your OTEL-instrumented service automatically creates child spans under that trace. The trace ID is also stored on the inference result for collector-side correlation.
#### 1. Enable trace context propagation on your endpoint connection
In your **Conversation** endpoint connection, expand the **Advanced Options** section and scroll to **Headers**. Check the **Enable W3C trace context propagation** checkbox. This adds a `traceparent` header that Galtea will populate with the correct trace and span IDs on each inference call:
```
traceparent: 00-{trace-id}-{span-id}-01
```
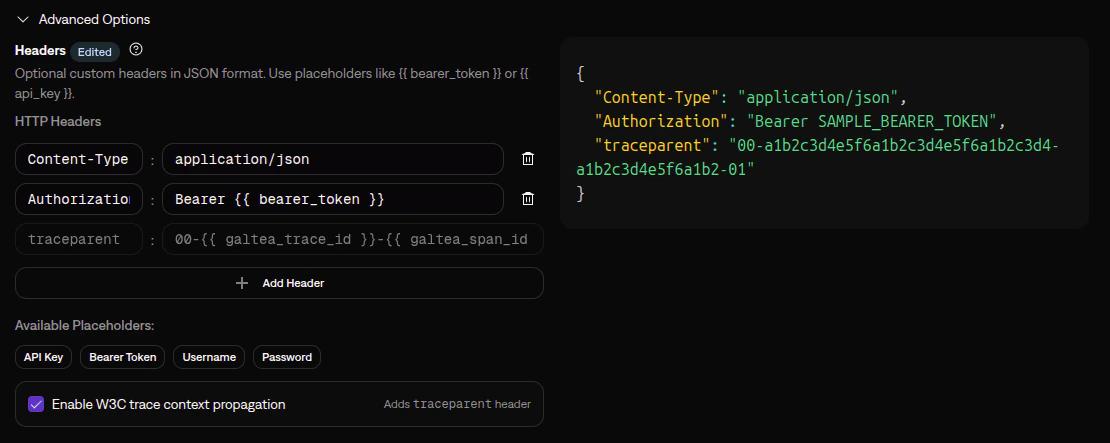 When the checkbox is unchecked, no `traceparent` header is sent to your endpoint, and trace context is not propagated.
This option is only available for **Conversation** endpoint connections — the ones that handle inference calls. Initialization and Finalization endpoints are session lifecycle calls where trace correlation does not apply.
The trace ID is stored on each inference result and visible in the dashboard, so you can correlate traces even without checking your observability platform.
#### 2. Configure your service for OTEL
Ensure your service has OpenTelemetry instrumentation enabled. Most frameworks support [auto-instrumentation](https://opentelemetry.io/docs/zero-code/) which requires no code changes:
```bash theme={"system"}
# Python example
pip install opentelemetry-distro opentelemetry-exporter-otlp
opentelemetry-bootstrap -a install
```
#### 3. Send your spans to Galtea
Point your OTel exporter or Collector at Galtea's public OTel endpoint. [Send OpenTelemetry Traces to Galtea](/sdk/tutorials/send-opentelemetry-traces-to-galtea) covers the endpoint, the `Authorization: Bearer ` requirement, the exporter and Collector configuration, and a curl check to verify your key.
Once configured, spans from your service will be automatically linked to the corresponding Galtea inference results via the shared trace ID.
This approach only works for **Direct Inference** (where Galtea initiates the call to your endpoint). For SDK-based connections where your code calls the Galtea API, use the SDK's [trace context](/sdk/api/trace/set-context) mechanism instead.
To control how span content maps to Trace records (the `galtea.trace.*` attributes and the automatically mapped OTel fields), see [How span content maps to Trace records](/sdk/tutorials/send-opentelemetry-traces-to-galtea#how-span-content-maps-to-trace-records). To create production sessions from OTel traffic without Direct Inference, see [Monitor Real User Traffic via OpenTelemetry](/sdk/tutorials/monitor-real-user-traffic-with-opentelemetry).
## Learn More
Full reference for configuring endpoint connections
Learn about versions and how endpoint connections integrate with them
Understand how evaluations work
Browse available metrics for evaluating your AI
Capture and analyze your agent's internal operations
When the checkbox is unchecked, no `traceparent` header is sent to your endpoint, and trace context is not propagated.
This option is only available for **Conversation** endpoint connections — the ones that handle inference calls. Initialization and Finalization endpoints are session lifecycle calls where trace correlation does not apply.
The trace ID is stored on each inference result and visible in the dashboard, so you can correlate traces even without checking your observability platform.
#### 2. Configure your service for OTEL
Ensure your service has OpenTelemetry instrumentation enabled. Most frameworks support [auto-instrumentation](https://opentelemetry.io/docs/zero-code/) which requires no code changes:
```bash theme={"system"}
# Python example
pip install opentelemetry-distro opentelemetry-exporter-otlp
opentelemetry-bootstrap -a install
```
#### 3. Send your spans to Galtea
Point your OTel exporter or Collector at Galtea's public OTel endpoint. [Send OpenTelemetry Traces to Galtea](/sdk/tutorials/send-opentelemetry-traces-to-galtea) covers the endpoint, the `Authorization: Bearer ` requirement, the exporter and Collector configuration, and a curl check to verify your key.
Once configured, spans from your service will be automatically linked to the corresponding Galtea inference results via the shared trace ID.
This approach only works for **Direct Inference** (where Galtea initiates the call to your endpoint). For SDK-based connections where your code calls the Galtea API, use the SDK's [trace context](/sdk/api/trace/set-context) mechanism instead.
To control how span content maps to Trace records (the `galtea.trace.*` attributes and the automatically mapped OTel fields), see [How span content maps to Trace records](/sdk/tutorials/send-opentelemetry-traces-to-galtea#how-span-content-maps-to-trace-records). To create production sessions from OTel traffic without Direct Inference, see [Monitor Real User Traffic via OpenTelemetry](/sdk/tutorials/monitor-real-user-traffic-with-opentelemetry).
## Learn More
Full reference for configuring endpoint connections
Learn about versions and how endpoint connections integrate with them
Understand how evaluations work
Browse available metrics for evaluating your AI
Capture and analyze your agent's internal operations